Reflection - A Datadashboard with Spotlight Reports
Dashboards have become the front-end and first line of access to business intelligence and often the best way to gain insight into an organization’s operations and performance. Data
dashboards allow managers to monitor the contribution of the various departments in their organization. To gauge exactly how well an organization is performing overall, dashboards allow you to
capture and report specific data points from each department within the organization, thus providing a "snapshot" of performance.
WebHawkx Dashboard provides instant views of KPIs (key performance indicators) relevant to a particular activity in perspective or a business process. The dashboards are one of the most
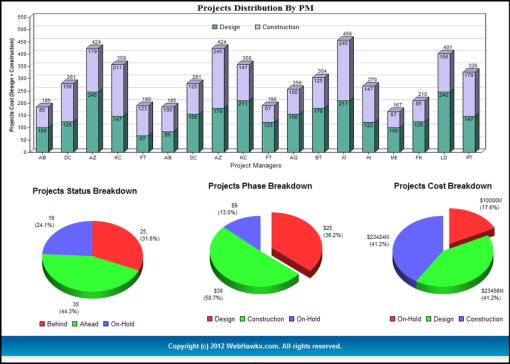
reliable part of Business Performance Management (BPM). Webhawk Dashboards are series of graphs, charts, and other visual indicators that can be monitored and interpreted instantly during the design
and execution phase of any tangible activity of the project.
Some key features of Webhawk Data Dashboard:
1. Visual presentation of performance measures
2. Ability to identify and correct negative trends
3. Gain total visibility of all systems instantly
4. Perspectives – groupings of high level strategic areas
5. Measures – also called Metric or Key Performance Indicators (KPIs)
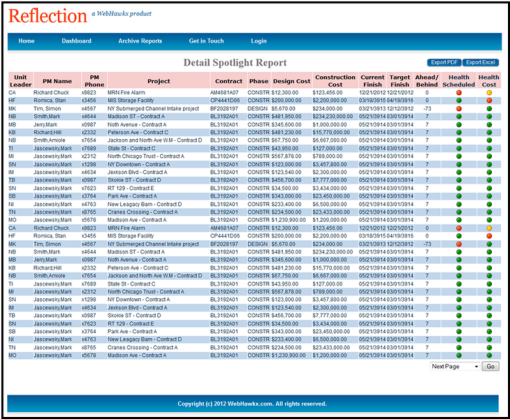
6. Spotlight Indicators – red, yellow, or green symbols that provide an at-a-glance view of a measure’s performance.
Bells and whistles:
- Secure Login
- Dataoverload - Inside of data.
- Rich Graphs
- Analytics - analytical capability.
- Real Time Alerts (real time SMS and email system)
- Live Reports - Live statistical and drill down reports.


